Showing posts with label data visualisation. Show all posts

Thursday, 19 May 2011

Make it physical

Two lovely pieces of work by Australian Mitchell Whitelaw


Measuring cup visualises (physicalises? concretises?) 150 years of Sydney temperature data as a small cup, made using a 3D printer:

Each horizontal layer of the form is a single year of data; these layers are stacked chronologically bottom to top - so 1859 is at the base, 2009 at the lip. The profile of each layer is basically a radial line graph of the monthly data for that year. Months are ordered clockwise around a full circle, and the data controls the radius of the form at each month. The result is a sort of squashed ovoid, with a flat spot where winter is (July, here in the South).


Weather bracelet visualises a year of Canberra's weather data:

The form consists of a single house-shaped slice, where the shape of each slice is based on temperature data from a single day. The width is static, the height of the peak is mapped to the daily maximum, and the height of the shoulder (or "eave") is mapped to the daily minimum.


Earlier this month, as part of the FutureEverything events in Manchester, the Data Dimension exhibition brought together data visualisations ranging from BERG's iPad light paintings to Zach Gage's 'Hit Counter'.

Personally, I'm picking the Dowse will be doing a show along these lines within the next 18 months. And guys, if you need some pointers for local talent - I know some people ....

Thursday, 24 February 2011

Split Second

If you haven't already done so, it's a good time to go check out Brooklyn Museum's latest online experiment, Split Second: Indian Paintings.

As Shelley Bernstein explains in a blog post, the project is inspired by Malcolm Gladwell's book Blink

The book explores the power and pitfalls of initial reactions. After reading it, I started to wonder how the same theories might apply to a visitor’s reaction to a work of art. How does a person’s split-second reaction to a work of art change with the addition of typical museum interpretive text? As visitors walk through our galleries, what kind of work are they drawn to? And if they stop, look, read, or respond, how does their opinion of that work change?

On the Split Second site, you're asked to interact with images of Indian paintings from the Museum's collections in three ways. First, you are briefly presented to two images, and asked to pick the one that interests you most. Next, you're asked to apply words to individual works, and then rate their appeal to you on a sliding scale. Finally, you're given a work with some interpretative text and asked to rate it.

The online aspect of the Split Second show ends on April 14. Curators will use the data collected to help determine the selection of works for the exhibition, which opens in July:

Visitors will be able to view a small selection of the paintings that generated the most controversial and dynamic responses during the evaluation process, accompanied by a visualization and analysis of the data collected.

This interest in data-driven curating calls to mind the attempt at the new MONA in Tasmania to gather visitor data through audio-tours. More subtle than a pure popularity contest (vote for what you want to see on the floor), Split Second is an interesting attempt to gauge what it is that attracts people to certain artworks, and how they respond to the contextual information presented (or left out) by museums, without a straigh-out survey. I'm looking forward to seeing the results.

Monday, 15 November 2010

Good looking

There are 15 days left until entries close for the Mix and Mash competition. If you're looking for some inspiration, you might want to check out the slides from the awesome presentations at the Mix and Mash Webstock Mini.

One of my favourite presentations was Chris McDowall's 'Anatomy of a visualisation':


Chris has a terrific blog about data visualation over on the Sciblogs network. Recently his wife Sienna Latham wrote about the data analysis she and Chris worked on to accompany her thesis on English women’s chymical activities during the reign of Elizabeth I. Together, they created a visual interpretation of the network of relationships between the women Sienna studied


I also picked up this amazing visualisation on Twitter today - contradictions in the Bible by Steve Wells


As it happens, there's a visualisation category in the Mix and Mash competition. So shuffle on over there and check it out!

Wednesday, 21 July 2010

Mid-week pretty

Actually, pretty AND smart


Slippy map generated from geo-tagged photos on Flickr, by Aaron Straup Cope

Monday, 9 November 2009

Visualise this

Sometimes I look at the line-up of blog posts in my feedreader and just think shoot, there are some frigging clever people out there.

Among these are several designers/design companies who I've started following relatively recently thatspecialise in data visualisation, including David McCandless's 'Information is Beautiful' and the amazing people at Berg.

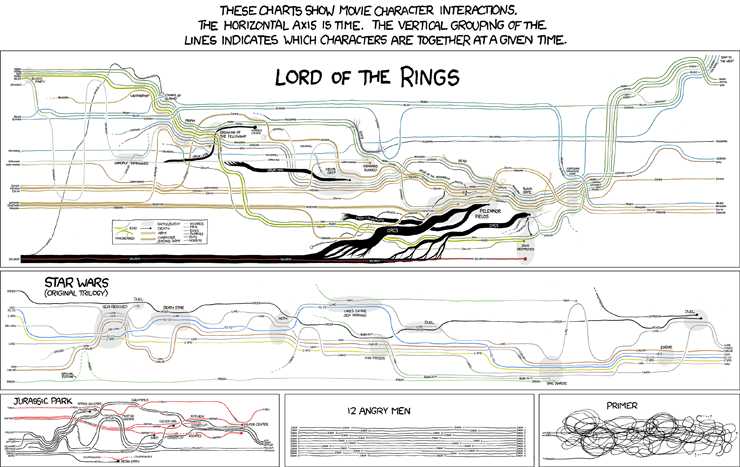
Over the past week, xkcd's visualisations of character interactions have been doing the rounds on the web (click here for the mega-full-size version, with Lord of the Rings galore)


This morning on my walk to work I was pondering some of the visualisations I'd like to see, relating to the New Zealand art world. Like:

The movements of a group of similarly-aged artists (e.g.Shane Cotton, Seraphine Pick, Michael Parekowhai and Peter Robinson) between dealers over the past 20 years.

A breakdown of the budgets for out 4 outings at the Venice Biennale (including the Trip of a Lifetime) including accommodation, meals, marketing, PR, materials, venue hire, flights, publications, photography; all measured against attendance and press coverage.

The distribution of McCahon works in public collections, measured in square centimetres.

Touring exhibitions of New Zealand art, showing relationships between originating and displaying institutions.